Sony miało dobry IV kw. 2012 r. - zestawienie IDC
IDC przygotowało własne zestawienie dotyczące producentów telefonów i smartfonów w IV kw. 2012 r. i w całym zeszłym roku. Wynika z niego m.in., że koncern Sony miał dobry czwarty kwartał i w tym okresie objął czwartą pozycję na rynku producentów smartfonów.
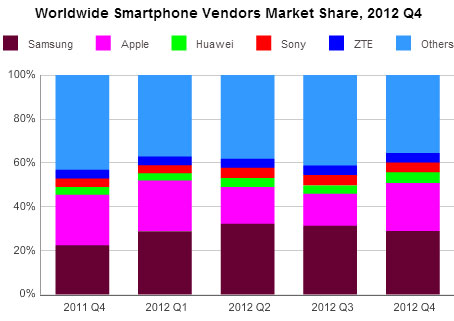
Top Five Smartphone Vendors, Shipments, and Market Share, Q4 2012 (Units in Millions)
| Vendor | 4Q12 Unit Shipments | 4Q12 Market Share | 4Q11 Unit Shipments | 4Q11 Market Share | Year-over-Year Change |
| 1. Samsung | 63.7 | 29.0% | 36.2 | 22.5% | 76.0% |
| 2. Apple | 47.8 | 21.8% | 37.0 | 23.0% | 29.2% |
| 3. Huawei | 10.8 | 4.9% | 5.7 | 3.5% | 89.5% |
| 4. Sony | 9.8 | 4.5% | 6.3 | 3.9% | 55.6% |
| 5. ZTE | 9.5 | 4.3% | 6.4 | 4.0% | 48.4% |
| Others | 77.8 | 35.5% | 69.2 | 43.1% | 12.4% |
| Total | 219.4 | 100.0% | 160.8 | 100.0% | 36.4% |
źródło: IDC Worldwide Mobile Phone Tracker, January 24, 2013
Top Five Total Mobile Phone Vendors, Shipments, and Market Share, Q4 2012 (Units in Millions)
| Vendor | 4Q12 Unit Shipments | 4Q12 Market Share | 4Q11 Unit Shipments | 4Q11 Market Share | Year-over-Year Change |
| 1. Samsung | 111.2 | 23.0% | 99.0 | 20.9% | 12.3% |
| 2. Nokia | 86.3 | 17.9% | 113.4 | 24.0% | -23.9% |
| 3. Apple | 47.8 | 9.9% | 37.0 | 7.8% | 29.2% |
| 4. ZTE | 17.6 | 3.6% | 20.6 | 4.4% | -14.6% |
| 5. Huawei | 15.8 | 3.3% | 13.9 | 2.9% | 13.7% |
| Others | 203.8 | 42.3% | 189.5 | 40.0% | 7.5% |
| Total | 482.5 | 100.0% | 473.4 | 100.0% | 1.9% |
źródło: IDC Worldwide Mobile Phone Tracker, January 24, 2013
Top Five Total Mobile Phone Vendors, Shipments, and Market Share, Q4 2012 (Units in Millions)
| Vendor | 2012 Unit Shipments | 2012 Market Share | 2011 Unit Shipments | 2011 Market Share | Year over Year Change |
| 1. Samsung | 215.8 | 30.3% | 94.2 | 19.0% | 129.1% |
| 2. Apple | 135.9 | 19.1% | 93.1 | 18.8% | 46.9% |
| 3. Nokia | 35.1 | 4.9% | 77.3 | 15.6% | -54.6% |
| 4. HTC | 32.6 | 4.6% | 43.6 | 8.8% | -25.2% |
| 5. Research In Motion | 32.5 | 4.6% | 51.1 | 10.3% | -36.4% |
| Others | 260.7 | 36.5% | 135.3 | 27.5% | 92.7% |
| Total | 712.6 | 100.0% | 494.6 | 100.0% | 44.1% |
źródło: IDC Worldwide Mobile Phone Tracker, January 24, 2013
Top Five Mobile Phone Vendors, Shipments, and Market Share Calendar Year 2012 (Units in Millions)
| Vendor | 2012 Unit Shipments | 2012 Market Share | 2011 Unit | 2011 Market Share | Year-over-Year Change |
| 1. Samsung | 406.0 | 23.4% | 330.9 | 19.3% | 22.7% |
| 2. Nokia | 335.6 | 19.3% | 416.9 | 24.3% | -19.5% |
| 3. Apple | 135.9 | 7.8% | 93.1 | 5.4% | 46.0% |
| 4. ZTE | 65.0 | 3.7% | 69.5 | 4.1% | -6.5% |
| 5. LG | 55.9 | 3.2% | 88.1 | 5.1% | -36.5% |
| Others | 737.5 | 42.6% | 716.8 | 41.8% | 2.9% |
| Total | 1735.9 | 100.0% | 1715.3 | 100.0% | 1.2% |
źródło: IDC Worldwide Mobile Phone Tracker, January 24, 2013
Komentarze / 1
Dodaj komentarz-
 Preza pisze: 2013-01-28 20:09Sony po prostu zaczelo robic dobre sluchawki. Ot cala tajemnica sukcesu. NO i launcher nie jest tak obrzydliwie inwazyjny jak w HTC czy tym bardziej w Samsungu0